While political priorities do not always result in implementation, it is hard to capture institutional conditions that enable this process using aggregate governance measures. This study investigates if the relationship of strategic prioritization and policy implementation in developing countries is influenced by administrative capacity. An exploratory cross-sectional analysis is one in which separate indicators are aggregated in the Blavatnik Index of Public Administration 2024 for 81 countries that are categorized as low- or middle-income. The strategic prioritization and implementation are based on the Bertelsmann Transformation Index 2024, administrative impartiality, and alternative measures of merit recruitment are based on V-Dem version 14. Ordinary least squares models use standardized variables, income-group and regional controls, and HC3 uncertainty estimates. Strategic prioritization is positively related to implementation in the interaction model (β = 0.805, 95% confidence interval [0.643, 0.967]). The interaction is negative (β = −0.118, [−0.211, −0.024]), which does not confirm the complementarity hypothesis proposed. It does, however, have specifications that are quadratic, overlap restrictions, an alternative capacity indicator, and a country-pairs bootstrap of 5,000. Using a regulatory-enforcement outcome that is separately generated also results in an imprecise interaction. Limited incremental predictive value of the interaction is seen in model-component ablation. There is no strong positive relationship between evidence and moderation in this sample, and evidence of institutional substitution is not found. Interpretation is limited by shared assessment frameworks, nonrandom country coverage, asynchronous reference periods, and unobserved confounding. The contribution is one that is measurement conscious, an examination of conditional associations, but not a causal estimate of the effects of leadership or the institutions.
Research ArticleGovernance and Public AdministrationIn progress
Leadership, Institutional Capacity, and Policy Implementation: A Study of Governance Challenges in Developing Countries
Correspondence: antara.sarkerdu@gmail.com
Abstract
Keywords strategic prioritizationadministrative capacitypolicy implementationdeveloping countriessecondary datainteraction models
1. Introduction
One of the major issues involved in implementation research is the gap between policy adoption and policy implementation. Classic explanations identify this distance in the coordination of interdependent decisions, in the discretion of actors implementing the decisions, and in the interplay of competing objectives and political conflict [1, 2, 3]. From this view, policy adoption is not equal to policy delivery, and it is not a fair measure of administrative achievement. The empirical question that is relevant is how the organization of priorities is related to the institutional arrangements through which the implementation is realized. This distinction is especially relevant in the context of governance issues in countries with administrative and economic systems that are different.
Institutional forms can be implemented without generating associated operational capabilities, and formal reforms can exist alongside ongoing implementation barriers [4, 5]. Policy-capacity scholarship also differentiates analytical, operational, and political capacities and does not presume that one generic governance score reflects all of these capabilities necessary for policy action [6, 7]. While these arguments may lead one to also want to study leadership and capacity in combination, they do not as such determine a priori that this interaction will be positive. The question in this paper is, how does administrative capacity affect the relationship between governmental strategic prioritization and policy implementation in developing countries? Leadership is interpreted in a restrictive way as the ability of government to prioritize strategically rather than the charisma, personality, or competence of individual leaders.
Administrative impartiality is used to look at institutional capacity and merit-based recruitment as a secondary dimension. Implementation is a government attribute, not a measure of the number of projects implemented or social welfare outcomes, and is assessed by experts. The study relies on disaggregated indicators as contained in the Blavatnik Index of Public Administration (BIPA) 2024 compilation that gathers data from various well-known sources [8]. It keeps 81 LMICs and explicitly omits the overall BIPA index from the explanatory model. It is cross-sectional and observational. While a longitudinal design would shed further light on the within-country change, the evidence put together in this report is not (and is not meant to be) a panel.
The paper's contribution is limited in scope of the data examined. It separates a broad prioritization–implementation connection from the more challenging proposition that administrative capacity is a corollary of such a connection. It then investigates the effect of varying the model components, functional form, outcome measure, and sample support in the interaction. This is not because leadership–institution relationships have not been studied before [9, 10] but because of known concerns regarding construct validity and multiplicative interaction models. Results indicate a positive prioritization association but offer weak support for the proposed positive interaction. There is not enough consistency among the diagnostic analysis results to support a generic institutional-substitution interpretation for the negative interaction in the main linear model.
Thus, measurement and specification dependence are not merely frustrations that need to be ignored by selective reporting but substantive conclusions about the nature of these data.
2. Literature and theoretical framework
2.1. Institutions, administrative capacity, and implementation
Institutions and capacity are two different concepts. Institutions arrange incentives and constrain interaction; capacity is the ability to engage in specific activity within a set of institutions [11, 12]. Fiscal, coercive, legal, and administrative capabilities do not necessarily go hand in hand. Thus, studies on latent dimensions and historical capacity indices caution against assuming the state's capacity as a monolithic entity that is capable or incapable [13, 14]. One measurement may be more suitable for one administrative function than another. Impartial administration is a particular institutional feature. It is not about the volume of people or money an organization has; it is about consistent treatment and about implementing rules. The impartiality-based view regards quality of government as the regular application of rules [15].
What is important in the context of the present study is that such predictable administrative behavior can help in implementing strategic priorities. But impartiality doesn't show whether agencies have adequate staff, technical skills, information systems, or budget. For this paper, the word "administrative-capacity proxy" is therefore used instead of "impartiality," being synonymous with "institutional capacity" in its entirety. It also makes a difference in writing about bureaucratic organization. Studies on organizational characteristics in relation to growth [16] and the relationship between bureaucratic structure and performance [17] are researched. Subsequent research returns to the importance and recognition of such relationships, as well as the limitations of cross-country correlations [18]. Development goals research also draws a contrast between state capacity and bureaucratic autonomy [19].
These studies, when viewed together, give reason to focus on administrative organization and to avoid the direct application of the findings of studies of growth or outcomes of development to the assessments of governmental implementation.
2.2. Strategic prioritization as a dimension of leadership
Strategic prioritization is related to formulating and communicating government goals. In the current context, it can be linked to implementation by decreasing the uncertainty about what to work on and by offering a starting point for coordination. This is a suggested process, not one that can be seen in the data set. Priority-setting is different from implementation: a government can set priorities without setting up activities that will lock toward those priorities. Implementation scholarship offers some motives to not make leadership the sole explanatory center. The bottom-up can influence policy implementation; the top-down may interact with local knowledge, routines, and conflict between different actors [1, 3, 20]. Relationships between actors, not just one type of leadership, are also important for evidence on political oversight and bureaucratic management.
The present relevant studies are on the political-bureaucratic incentives in a particular Indian development context [21] and on the management practices and project delivery in the Nigerian civil service [22]. Neither is considered here to be representative of all the developing countries or indicative of present individual officeholders. To explore the leadership aspect of the title, it is therefore helpful to have indicators that can be aggregated as a measure of priority. They are unable to distinguish between personal leadership and cabinet procedure, professional advice, or administrative planning. This measurement boundary is particularly relevant as the BTI prioritization item itself considers organizational and planning aspects [23].
2.3. Complementarity and a competing substitution proposition
The complementarity proposition is that there is a stronger link between strategic priorities and implementation when administrative arrangements make it more predictable. In this view, the priority setting is a source of direction, and administrative capability provides the means of action. Conceptual reasons exist for looking at such combinations in the form of the policy-capacity framework [7] and analysis of capacity deficits [6]. They do not say that the specific country-level exchange estimated here has to be positive. An alternative argument is that once administration has been established, there is less need for variation in strategic priority setting to drive implementation. In this view, administrative measures help to maintain execution in spite of the fluctuations of prioritization, resulting in a reduced prioritization slope as capacity increases.
This is a theoretical possibility but not a description of the current data identifying substitution. Additionally, a negative statistical interaction may be due to nonlinear main relationships, limited support, coarsening of assessment or measurements, or common assessments. The hypotheses are formulated at an observable association level. Including contextual variables, H1 suggests a positive association between strategic prioritization and implementation. H2: There is a positive relationship between the implementation in the additive specification and administrative impartiality. H3: Administrative impartiality positively moderates the prioritization–implementation association. The interpretation of the model's interaction results (H1 and any capacity main coefficient) is at the mean of the other interaction partner's standardized variable and not as unconditional relationships.
Institutions and capacities are also subjects of politics and history. Research focuses on incentives to invest in state capacity [24] and stresses the endogenous development of state capacity [25]. Therefore, the theory that prioritization, capacity, and implementation are in order cannot be transformed into causal identification by arranging the variables on the right side of a regression. The empirical analysis examines patterns that are conditional or unconditional to test hypotheses, not the effects of hypothetical interventions.
3. Data and methods
3.1. Study design, sources, and analytical sample
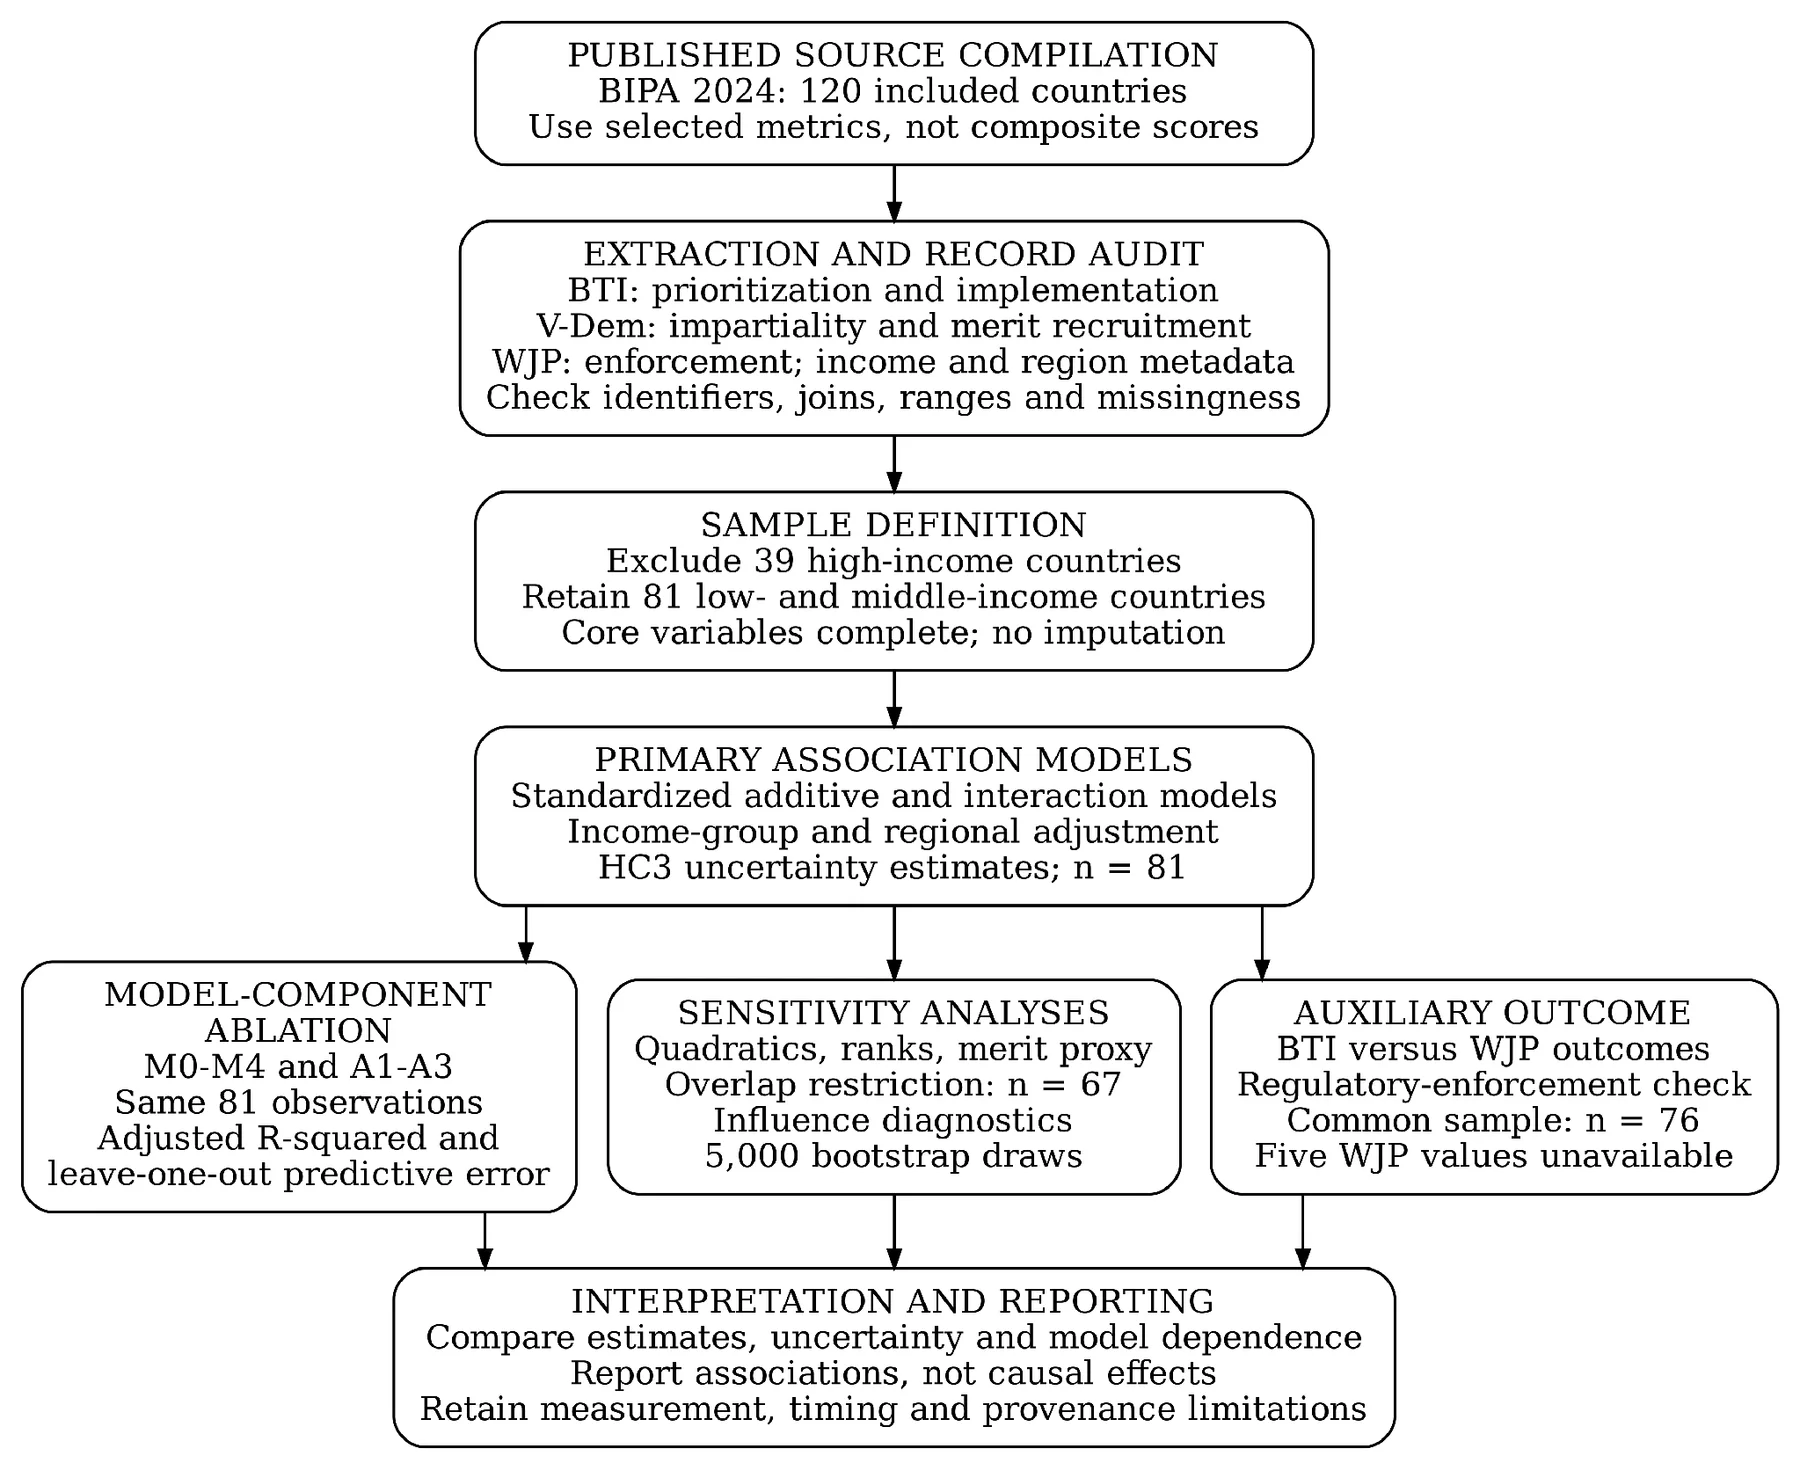
Developing countries are the countries that are classified as low, lower-middle, or upper-middle income in its frozen 2023 classification file. This refers to the country's classification for 2024, according to the World Bank, and not the current income classification of the countries [28]. The number of countries in the compilation is 120, of which 39 are high-income countries, leaving 81 observations. All 81 have provided values for the prioritization indicator, implementation indicator, administrative impartiality, and alternative recruitment indicator. There are 76 observations in the auxiliary regulatory-enforcement analysis (five of which are missing). In the country selection, the direction or statistical significance of results is not followed, but on the basis of this rule. The income definition is a clear sample rule, rather than a statement that economic classification is all-encompassing of development. The sample is not a random sample, and it is not a census of all LMICs. Antecedent coverage decisions made by BIPA are a component of the selection process. The unit of analysis is the country, and each country gets equal weight in the compilation. Figure 1 summarizes the process of the source-to-analysis workflow. No synthetic data is added to the analysis, which is based on published country-level data.
3.2. Reference periods and measurement
The label on the compilation is for the year 2024 and does not necessarily mean that the variables are for the same calendar year. BTI 2024 evaluates February 2021–January 2023 [23]. The V-Dem data are 2023 measurements based on the V-Dem version 14 (V-Dem 14), while the auxiliary World Justice Project (WJP) data is derived from WJP's 2023 release [27, 29, 30]. So, capacity is not specified as a preceding assessment of implementation. This cross-section is not duplicated annually, not lagged, nor affected by country fixed effects or round effects.
Table 1. Operationalization and reference periods
| Variable | Underlying source / metric | Reference period | Released range | Interpretive boundary |
|---|---|---|---|---|
| Implementation | BTI Q14.2; BIPA 30101.02 | 2024 round: Feb 2021–Jan 2023 | 0–0.8 | Expert-assessed execution, not project completion |
| Strategic prioritization | BTI Q14.1; BIPA 10102.01 | Same BTI assessment window | 0–0.8 | One governmental leadership dimension |
| Administrative impartiality | V-Dem v14, v2clrspct; BIPA 10401.04 | 2023 | 0–1 | Administrative-quality proxy; not all capacity |
| Merit recruitment | V-Dem v14, v2stcritrecadm; BIPA 40302.03 | 2023 | 0–1 | Alternative moderator; distinct dimension |
| Effective regulatory enforcement | WJP 2023 subfactor 6.1; BIPA 20302.01 | 2023 release | 0–1 | Auxiliary outcome; different implementation domain |
| Contextual controls | Frozen income classification; BIPA region | Income: FY2024 grouping | Groups | Three income groups and five regions |
Empirical min–max rescaling is used for BIPA so that the selected BTI variables are rescaled to 0–0.8 and the other selected variables to 0–1 (published values are rounded to 2 decimals). This isn't a percentage of policies achieving success. Those released values are used for the analysis and not purported to be original observations that have not been rounded [26]. Standardization eliminates the reliance on precisely applied positive affine transformations, but it does not untie the knots of rounding, and it does not restore the original latent scale nor allow for ordinal assessments to become truly continuous. There are three validity boundaries, which are consequential. For one, administrative impartiality is not a full measure of resource capacity. Second, merit-based recruitment is a different administrative dimension, and a different measurement of the sensitivity of the moderator test is a replacement, not an interchangeability. Third, BTI prioritization is a different item than implementation, and it is both part of a single assessment process. Their connection can manifest itself in substantive overlap and shared evaluation procedures. This concern is supported by common-method scholarship, but it is not possible to quantify the extent of the concern using the current data.
3.3. Extraction, audit, and reproducibility
A read-only interface to the pinned public repository was used to extract selected metric rows, which were then transcribed into machine-readable extracts. The audit verified country-key uniqueness, indicator IDs, indicator metric-row counts, numeric ranges, and one-to-one joins. The 5 selected publisher metric blocks have 98, 98, 120, 120, and 113 observations, respectively. Filtering and merging results in the 81 observation core sample described above. No missing value is replaced with zero and valid normalized zeros are not considered missing, while missing auxiliary values stay missing. The country identifiers in the analytic CSV file are substituted with observation identifiers, and the executable replication files reproduce all of the reported analyses. The package contains the publisher's commit references and git blob identifiers and provides a downloader to check complete hashes of source files and compare a new extraction with the observations. This environment did not allow for full-file download and hash verification. This is not to say that the numerical analyses were not carried out, but it is a remaining provenance check; all the models, diagnostics, and figures reported were based on the extracts retrieved. The retrieval/transcription limitation should be addressed prior to submission to a journal to the complete pinned files.
3.4. Statistical specification and uncertainty
In the core sample of 81 observations, their sample means and sample standard deviations standardize implementation, prioritization, and administrative impartiality. The main specification is (1)
Y is implementation standardized, L is strategic prioritization standardized, C is administrative impartiality standardized, and X includes indicators of income group and BIPA region. There are three income groups and five represented regions, which add two and four indicator parameters, respectively, in addition to the intercept. These coarse contextual variables are added for descriptive adjustment rather than for proposed removal of confounding caused by economic resources, conflict, regime characteristics, and historical institutional development.
The model for linear association is ordinary least squares (OLS), which is transparent. The outcome is coarse-grained and bounded, and the coefficients are not interpreted over the real line of performance. Covariance estimates by HC3 reduce the sensitivity of the standard error estimation to heteroskedasticity and leverage; the resulting confidence intervals are based on the distribution t(32) [32, 33]. HC3 will not correct for model misspecification, dependence across countries, or error in outcome measurement.
The conditional prioritization association is:
(2)
Its standard error involves the covariance between the prioritization and interaction coefficients. The interpretation of the marginal associations and the 95% confidence intervals (CI) for each point are done according to the principles of interpretation of an interaction model [34] and reported for the observed values of the moderator. The coefficient's p-value is not considered a criterion for substantive importance; lack of precision is not the same as evidence of no relationship [35].
3.5. Model-component ablation and predictive comparison
Ablation is treated as a comparison of parts of the model with each other, not as an experiment (performed on the same sample). M0 is contextual control, M1 is prioritization, M2 is impartiality, M3 has both main terms, M4 has both main terms and their product. There are three other specifications that exclude income indicators, region indicators, or both from M4. The hierarchy of interaction terms is kept (after removing the prioritization block the interaction is removed as well, and after removing the capacity block the interaction is removed as well). There is no ablation which leaves a product without discarding one of the main terms that constitute it. These 81 observations are all used in all eight models. Adjusted R² accounts for in-sample fit; leave-one-out cross-validation (LOOCV) root-mean-square error accounts for prediction in a held-out country within the domain of this sample. In linear least squares, deleted-observation residuals are equal to eᵢ/(1 − hᵢᵢ), where hᵢᵢ is leverage. Errors are reverted to the published implementation scale. A diagnostic of incremental predictive information rather than causal validation or external validation in an independent population is provided by cross-validation [36]. The results are not used to tune any hyperparameters.
3.6. Robustness and diagnostic strategy
Six diagnostics address different vulnerabilities. Quadratic prioritization and capacity terms examine whether the linear interaction is standing in for curvature. An alternative moderator uses merit-based recruitment. A support audit divides impartiality into three approximately equal-frequency bands while preserving ties, then restricts prioritization to the intersection of the observed ranges across those bands. This simple restriction is a descriptive overlap diagnostic, not a claim to implement the full estimator or eliminate all extrapolation concerns identified in interaction-model diagnostics [10]. A midrank transformation of the three core variables assesses sensitivity to their numerical scale. Leave-one-country-out fits examine whether the interaction depends on one observation, alongside leverage and Cook’s distance [37]. A 5,000-draw country-pairs bootstrap supplies a percentile interval using fixed full-sample standardization and a fixed random seed; rank-deficient draws would be discarded, although none occurred [38].
These intervals quantify model-based uncertainty under their respective procedures, not uncertainty from representative probability sampling or latent indicator estimation. Finally, an auxiliary WJP outcome assesses whether a related implementation domain produces a similar pattern without sharing BTI as the outcome publisher. BTI and WJP models are compared on the same 76-country sample. Regulatory enforcement is not equivalent to overall policy implementation, and its substitution is not a definitive common-method-bias test. These analyses were exploratory and not preregistered. Every fitted diagnostic specification described here is reported, including those that weaken the main result.
4. Results
4.1. Sample composition, distributions, and support
It covers a sample of 13 low-income countries, 33 lower middle-income countries, and 35 upper middle-income countries. The BIPA regions represented include 29 observations in Sub-Saharan Africa, 15 observations in the Americas, 14 observations in Asia and the Pacific, 13 in the Middle East, North Africa, and Central Asia, and 10 in Eastern Europe. These categories represent geographical groupings of the compilation, rather than separate explanatory mechanisms.
Table 2. Descriptive statistics for the analytical variables
| Variable | N | Mean | SD | Minimum | Maximum |
|---|---|---|---|---|---|
| Implementation | 81 | 0.336 | 0.111 | 0.000 | 0.530 |
| Strategic prioritization | 81 | 0.356 | 0.135 | 0.000 | 0.800 |
| Administrative impartiality | 81 | 0.382 | 0.175 | 0.000 | 0.780 |
| Merit recruitment | 81 | 0.427 | 0.152 | 0.000 | 0.750 |
| Regulatory enforcement | 76 | 0.377 | 0.136 | 0.000 | 0.750 |
In this sample, there are 7 values for implementation, and the published normalized standard deviation is 0.111. The correlation between implementation and prioritization is 0.840, between implementation and impartiality is 0.452, and between prioritization and impartiality is 0.496 (Pearson correlation). These unadjusted associations are not independent of the common measurement processes. The actual support of the two key predictors is depicted in figure 2. The impartiality band in the middle shows less variation in prioritization than does the entire sample. The overlap of the observed prioritization range of the three bands is 0.27-0.53, providing 67 observations. The band counts and ranges are given in Supplementary Table S1. Thus, the smooth interaction curve is not interpreted as equally supported over all possible combinations of predictors but rather must be interpreted in conjunction with the observed data.
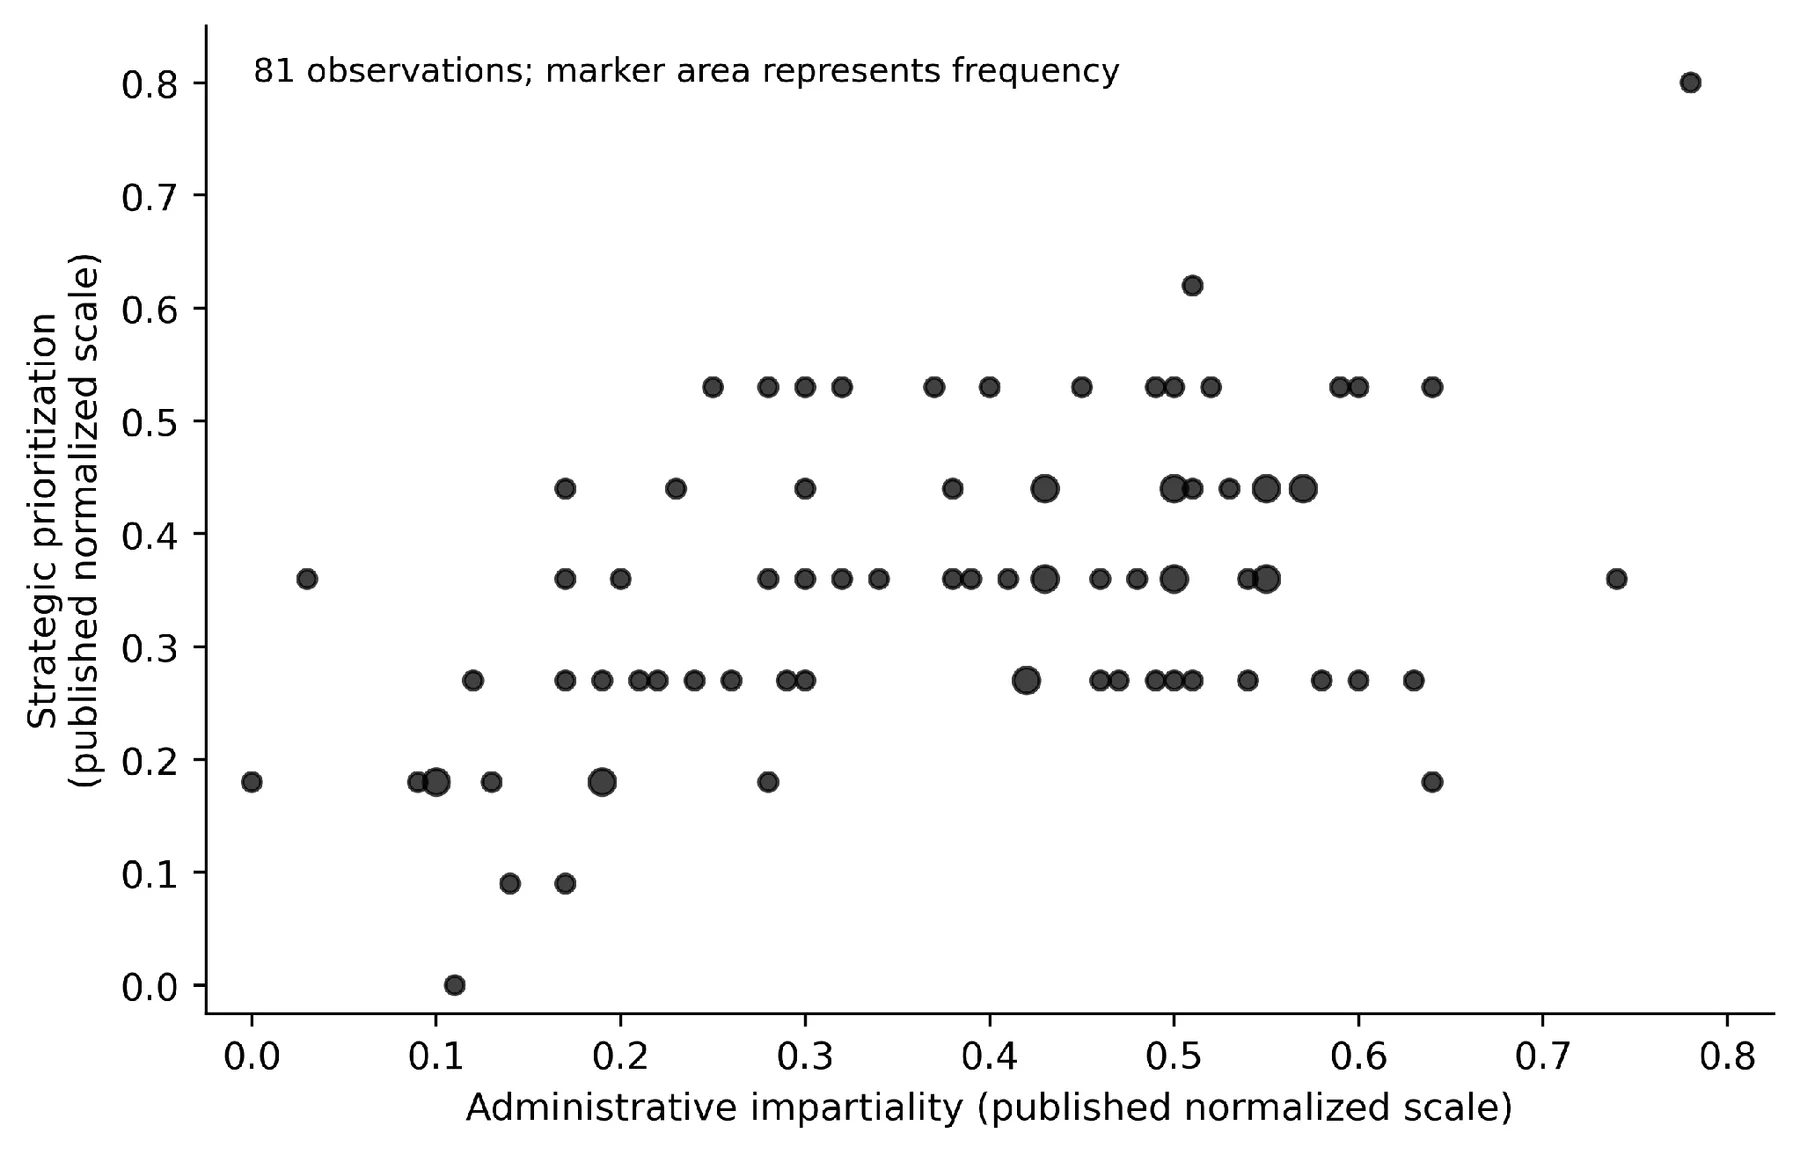
4.2. Main association models
The main regression results are presented in Table 3. After controlling for income group and region, prioritization is positively associated with implementation in M1 (β = 0.817, 95% CI [0.651, 0.983]). Impartiality is also positively related to implementation in M2 in the absence of prioritization (β = 0.394; [0.188, 0.600]). But the impartiality coefficient is much smaller and not as precise when both main terms are included in M3 (β = 0.040, [−0.131, 0.211]). Hence, an implementation of H2 is not available for the given additive model. This finding is about the conditional contribution of the chosen proxy and not that institutions are irrelevant for implementation.
Table 3. Standardized associations with policy implementation
| Term | M1 | M2 | M3 | M4 |
|---|---|---|---|---|
| Prioritization | 0.817 [0.651, 0.983] | — | 0.799 [0.604, 0.994] | 0.805 [0.643, 0.967] |
| Impartiality | — | 0.394 [0.188, 0.600] | 0.040 [−0.131, 0.211] | 0.013 [−0.146, 0.171] |
| Prioritization × impartiality | — | — | — | −0.118 [−0.211, −0.024] |
| Income / region controls | Yes. | Yes. | Yes. | Yes. |
| N | 81 | 81 | 81 | 81 |
| Adjusted R² | 0.711 | 0.278 | 0.708 | 0.726 |
The prioritization coefficient for mean impartiality is 0.805 [0.643, 0.967], and the impartiality coefficient for mean prioritization is 0.013 [−0.146, 0.171] for M4. The interaction is −0.118 [−0.211, −0.024], with p = .014. The estimated sign is the opposite of the complementarity expectation of H3. At this point, the outcome is a negative interaction in a specific linear model of observation, but not a recognized mechanism of substitution. The conditional relationship is made explicit in figure 3. A one-standard-deviation difference in prioritization is associated with 0.968 implementation standard deviations at the 10th percentile of impartiality. At the 90th percentile, the corresponding association is 0.672 [0.487, 0.858]. Both are positive, and the fitted slope decreases with impartiality. These quantities refer to the relative strength of the association implied by the model and are not statistics that would be expected to be observed after an intervention that led to an increase in a country's prioritization or capacity.Figure 3. Conditional association between prioritization and implementation.
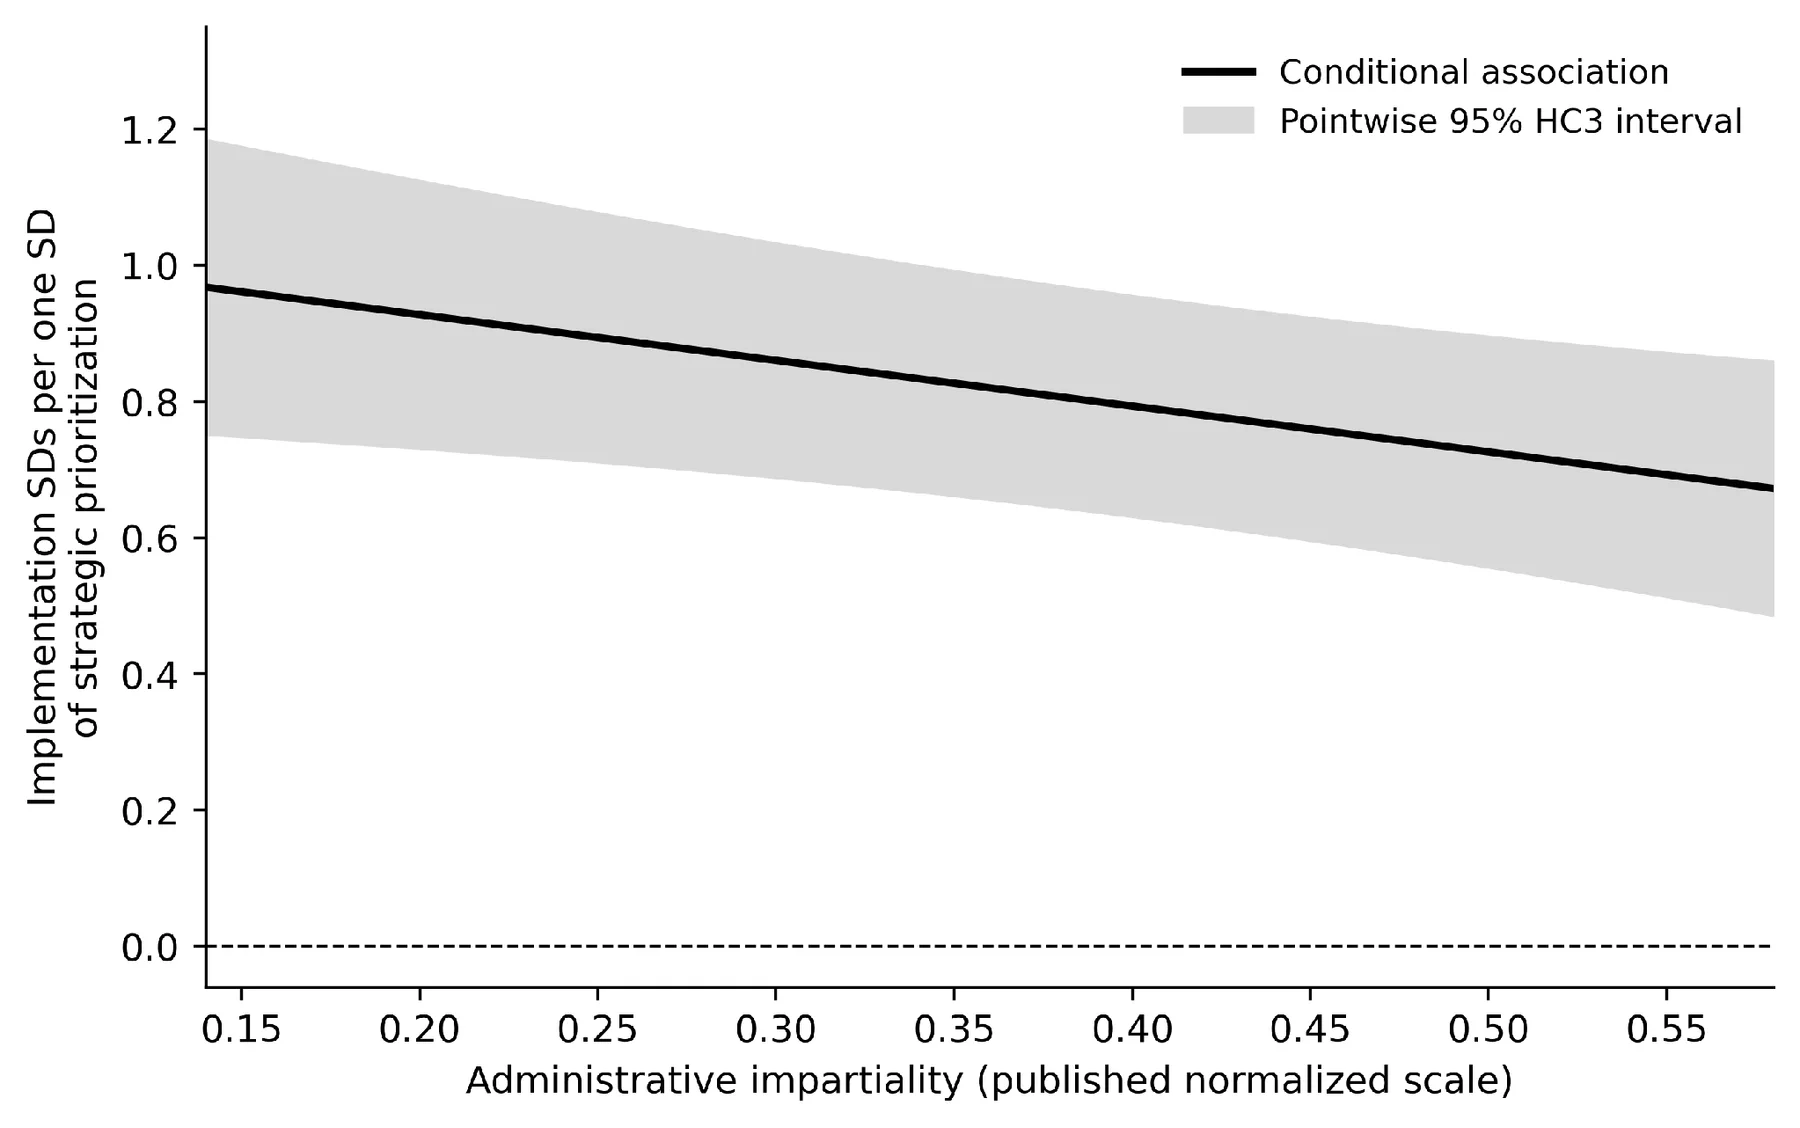
4.3. Model-component ablation
The results of the contribution of each model component on the common sample are presented in Table 4 and Figure 4. Only context results in adjusted R2=0.152 and LOOCV RMSE=0.107. If the prioritization is added, the latter becomes 0.063, while the latter if the impartiality is added without prioritization is 0.099. The LOOCV RMSE of the additive model is 0.064. It gets down to 0.062 in the interaction model, which is about 0.0024 normalized-scale units better than M3.
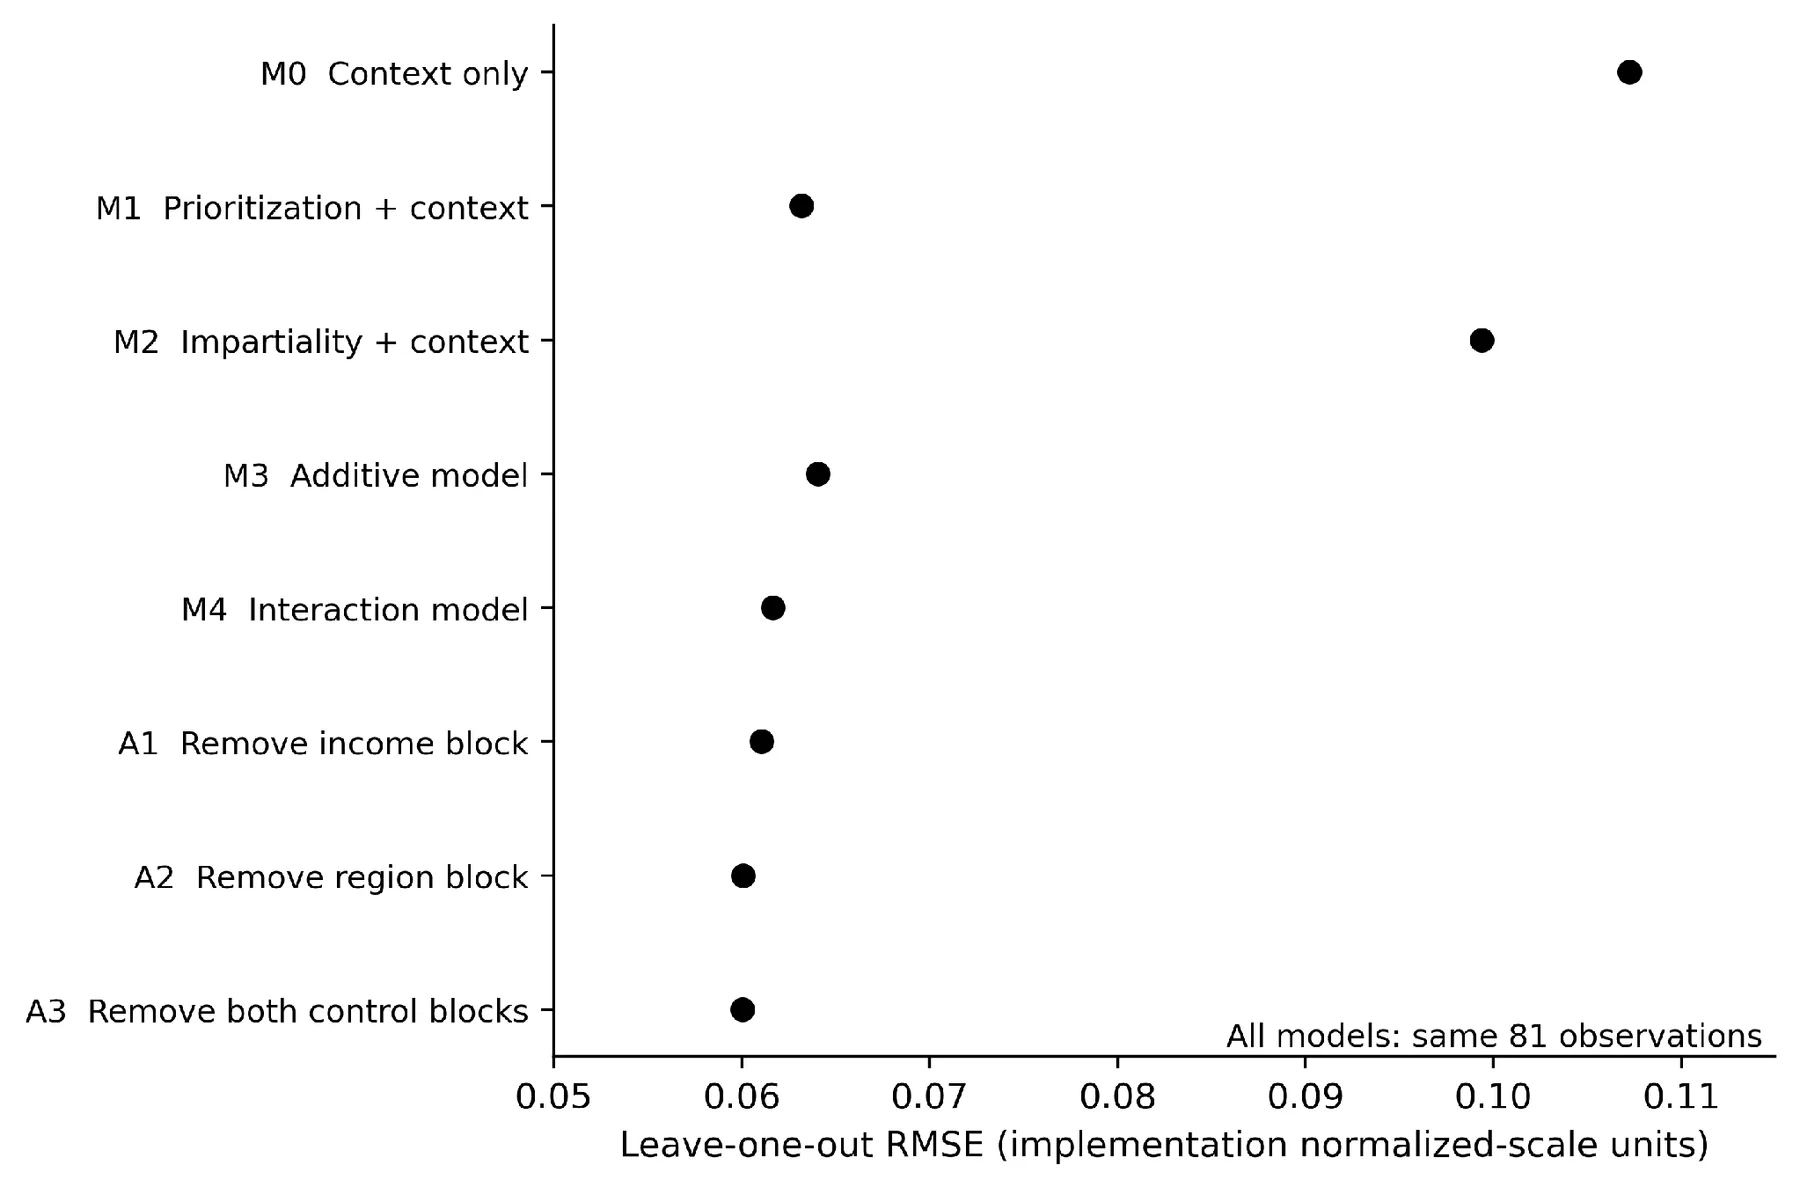
Table 4. Same-sample model-component ablation
| Specification | Model size | Adjusted R² | RMSE | LOOCV RMSE | R² loss vs. M4 |
|---|---|---|---|---|---|
| M0: Context only | 7 | 0.152 | 0.097 | 0.107 | 0.542 |
| M1: Prioritization + context | 8 | 0.711 | 0.056 | 0.063 | 0.021 |
| M2: Impartiality + context | 8 | 0.278 | 0.089 | 0.099 | 0.416 |
| M3: Additive | 9 | 0.708 | 0.056 | 0.064 | 0.020 |
| M4: Interaction | 10 | 0.726 | 0.054 | 0.062 | 0.000 |
| A1: Remove income | 8 | 0.724 | 0.055 | 0.061 | 0.009 |
| A2: Remove region | 6 | 0.725 | 0.056 | 0.060 | 0.015 |
| A3: Remove both controls | 4 | 0.718 | 0.057 | 0.060 | 0.029 |
The increase in the in-sample R² when going from M3 to M4 is 0.020. This gain is very small compared to the contribution of the prioritization block. For comparison, the in-sample R² of the models is lower, but M4 with income or region or both removed from the model yields slightly lower cross-validated error. This difference shows the difference between sample variation and held-out observations. It does not imply that neither income nor regional context is irrelevant in the causal analysis. That the contextual blocks were substantively motivated is the main reason that M4 is the primary descriptive specification, not that it is in some predictive competition.
4.4. Sensitivity of the interaction
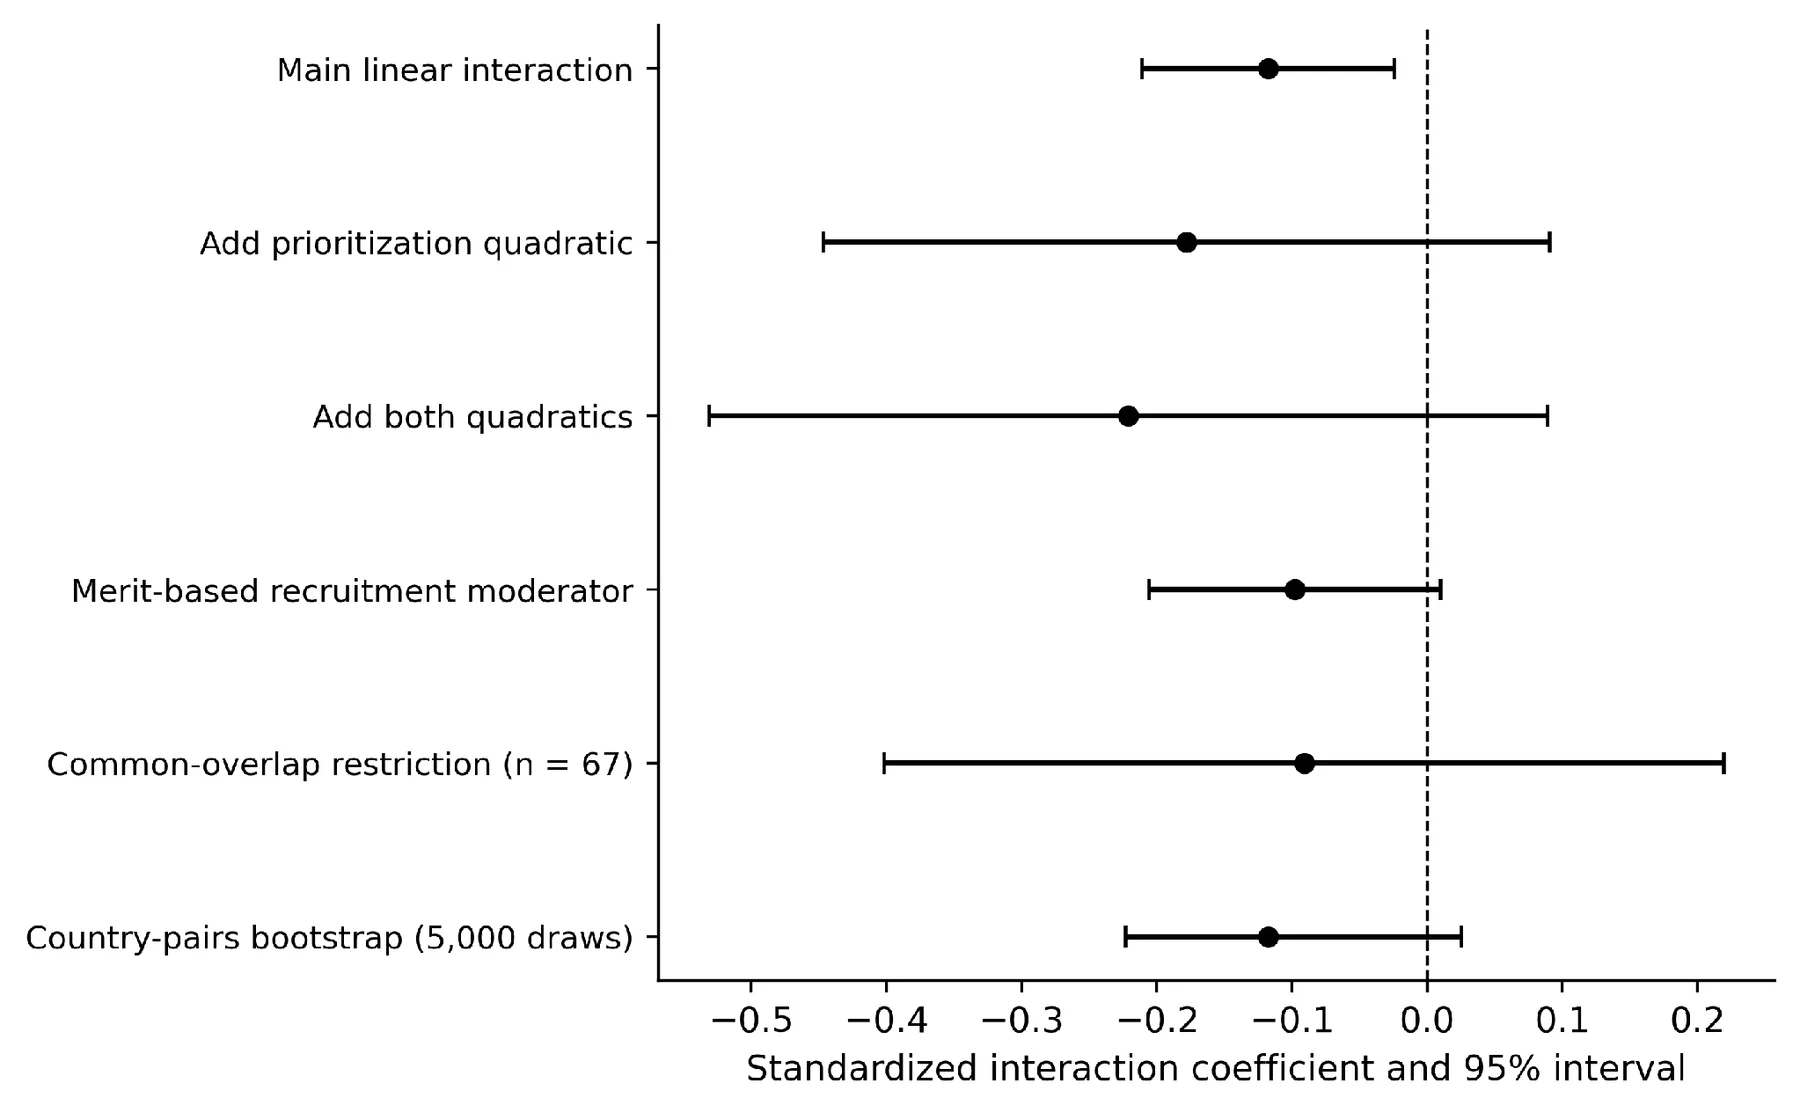
The results from all diagnostics in Table 5 indicate that the negative main interaction is not consistently different from zero. Adding a prioritization quadratic yields β = −0.178 [−0.447, 0.091]; adding both quadratics yields β = −0.221 [−0.531, 0.089]. The new point estimates are both negative, with greater uncertainty. Such specifications fail to show that the curvature was the only cause for the original outcome and show that the inference relies on restrictions on the functional form.
Table 5. Interaction sensitivity analyses
| Specification | N | Interaction | 95% interval | p |
|---|---|---|---|---|
| Main linear interaction | 81 | −0.118 | [−0.211, −0.024] | 0.014 |
| Add prioritization quadratic. | 81 | −0.178 | [−0.447, 0.091] | 0.191 |
| Add both quadratics. | 81 | −0.221 | [−0.531, 0.089] | 0.160 |
| Merit-recruitment moderator | 81 | −0.098 | [−0.205, 0.010] | 0.074 |
| Overlap restriction | 67 | −0.091 | [−0.401, 0.220] | 0.560 |
| Midrank transformation | 81 | −0.062 | [−0.210, 0.087] | 0.409 |
| Country-pair bootstrap | 81 | −0.118 | [−0.223, 0.026] | — |
The merit-recruitment moderator is −0.098 [−0.205, 0.010]. The common-overlap restriction produces −0.091 [−0.401, 0.220], while standardized midranks yield −0.062 [−0.210, 0.087]. The rank model alters the estimand, and the recruitment model alters the administrative dimension. They are not designed to assume that all the coefficients estimate the same underlying parameter but rather to reveal dependence on such choices. There are 81 leave-one-country-out interaction estimates, and all are negative, from −0.130 to −0.096. However, three p-values for the deleted-observation fits are greater than .05. The largest leverage is 0.615, and the largest Cook's distance is 0.121, suggesting that influence should be looked at, although the sign does not change with any individual deletion. No observation is dropped solely due to its influence. The country-pairs 5,000-draw country-pairs bootstrap percentile interval is [−0.223, 0.026], which overlaps with zero. The main interval comparisons are summarized in Figure 5. The group of diagnostics collectively do not support a stable negative moderation relationship in the main HC3 interval.
4.5. Auxiliary outcome comparison
The same-sample comparison in Table 6 distinguishes between changes in the outcome and changes in the countries covered. On the 76-country auxiliary sample, the BTI interaction is −0.127 [−0.219, −0.035]. The interaction becomes 0.005 [−0.388, 0.398] if the outcome is mached with effective regulatory enforcement based on WJP. This coefficient of prioritization is also less precisely estimated in the auxiliary model at 0.312 [−0.038, 0.663].
Table 6. Related outcomes on a common 76-country sample
| Term | BTI implementation | p | WJP enforcement | p |
|---|---|---|---|---|
| Prioritization | 0.831 [0.670, 0.992] | < .001 | 0.312 [−0.038, 0.663] | 0.080 |
| Impartiality | −0.021 [−0.176, 0.135] | 0.793 | 0.207 [−0.100, 0.513] | 0.183 |
| Interaction | −0.127 [−0.219, −0.035] | 0.008 | 0.005 [−0.388, 0.398] | 0.979 |
This is no definitive test for equating the coefficients, and the two outcome constructs are not mutually interchangeable. The auxiliary result, however, cannot be used as evidence that the negative interaction might be generalized into a related implementation domain measured outside BTI. Nor does it indicate that the BTI association is completely caused by measurement bias. What it does suggest is that the moderation pattern found here is not constant across the specific outcome operationalizations available.
5. Discussion
5.1. What the evidence establishes
The most consistent result is that BTI strategic prioritization is positively associated with BTI implementation. That correlation is in line with a description of H1. It is also compatible with the practical distinction between priority setting and how to implement these priorities: the two activities can be quite related but do not have to be equal. However, the model findings fail to distinguish whether the prioritization leads to implementation, or the successful implementation leads to prioritization, or whether both are a reaction to unknown organizational factors. That substantive contribution is in the disassociation of that principal association from the more robust complementarity assertion. There is a positive bivariate relationship between administrative impartiality and implementation; however, there is little additional linear association when prioritization is added.
Positive interaction is not facilitated. The negative main interaction should not be interpreted as evidence that administrative institutions supplant leadership, as the CI includes the value of zero for some defensible alternatives and for paired resampling. This distinction is analogous to the general methodological one that statistical interaction can be a property of a scale and specification and can also be a reflection of a theoretical mechanism [10, 34]. The null or weak conditional coefficient does not resolve the theoretical significance of institutional capacity. Implementation may be impacted by administrative arrangements such as staffing, budget, information, or coordination that the proxy does not include. Capacity might also affect the prioritization, and conditioning on prioritization might therefore strip some of an institutionally relevant association.
However, these possibilities can only be left dangling; a defensible causal structure and temporal design must regress them.
5.2. Measurement and the implementation literature
The results are consistent with a measurement-focused interpretation of implementation research. In classic studies, attention is given to chains of decisions and relations between organizations, whereas the street-level studies highlight how policies are put into practice [2, 20]. A national expert evaluation condenses such processes into a few categories. The value for cross-national description does not allay the loss of information between policy sectors, delivery stages, and heterogeneous agencies. The difference between an administrative form and an operational function is also relevant. State capability studies advise that formal organizational changes do not necessarily lead to implementation capability [4, 5]. An impartiality measure, on the other hand, may be used to explain rule-governed behavior without technical or resource adequacy.
The attenuation of the coefficient of the proxy in the present study is therefore not interpreted as support for the capacity-based explanations, in general. The auxiliary outcome comparison underscores the importance of making implementation domain distinctions. The regulatory enforcement focuses on how well the government applies regulations, while the BTI implementation focuses on how well the government carries out its own policy. Correlation between related constructs does not necessarily imply that they react alike to the same explanatory variables. Information on unfinished development projects as sector-specific evidence shows the additional information that a more concrete outcome can provide [40]. This current overall analysis does not reconstruct those sequences at the project level.
5.3. Implications for subsequent research
The evidence shows that there are three areas of focus for improved empirical tests. First, there needs to be more conceptual and source separation for leadership, inputs from administration, and output from implementation. A mechanism using a combination of strategic documents, staffing and expenditure data, and independently evaluated delivery milestones would provide a more specific test than the current indicator interaction. Second, assessment periods should be scheduled in such a way that institutional conditions and prioritization clearly come first before the implementation episode. Thirdly, regularities at the country level must be compared to the within-country and policy-specific variation and not assumed to apply to all agencies.
The implications are for the design of research, not for a specific political actor or institutional change. The current estimates do not set out what would occur if a government changed its leadership structures, recruitment practices, or administrative support. They also do not offer any foundation to compare countries or to evaluate the individual officeholders. The relevant contribution is the information about the conditional relationships that can be seen in the measures chosen, plus a clear description of the point where this information becomes unclear.
6. Limitations
Five constraints have limited the conclusions. Coverage and selection: The 81 countries are a coverage-defined subset of a compilation of benchmarking countries; there are no sampling weights and missing-country corrections to make the countries representative of all developing countries. Timing and identification: The BTI assessment window is separate from 2023 capacity observations, and the design is not a credible instrument within countries. Reverse causality and unobserved confounding are still a possibility.
Measurement: over-lap between planning/organizing and prioritizing the item, the capacity indicators lack the dimensions of resource and technical, and the implementation outcome is a rounded expert assessment (7 realized categories). No propagation of measurement uncertainty of the original V-Dem is made. For this study, there are no measurable biases of the shared-source ratings, which may inflate and/or alter associations. BIPA normalization is not separate but rather "inherited" from all of the original source files.
The statistical specification: HC3 is not dealing with cross-country dependence, nor is it dealing with an incorrect conditional-mean model. Quadratic, rank, overlap, and bootstrap checks show uncertainty but are not comprehensive of all potential specifications. The confidence intervals assume the statistical assumptions and the sample size is small with one high leverage observation. The paper does not select a preferred significant specification from the diagnostic set and exploratory p-values are not converted to a multiple-testing confirmatory context.
Provenance: this was done with the numbers, with checked repository extracts, but hasn't been done with complete-file hash checking because it wasn't possible to download the files. It may be verified with the companion verification script, and the manuscript should not be submitted until it has been verified. This is a pragmatic restriction, which is not a restriction of the source indicators per sector.
7. Conclusion
This study examines leadership, institutional capacity, and policy implementation through an exploratory cross-sectional analysis of 81 low- and middle-income countries. Strategic prioritization is positively associated with expert-assessed implementation, but the hypothesized strengthening of this relationship by administrative impartiality is not supported. A negative interaction in the main linear model is sensitive to alternative specifications, capacity measurement, overlap restrictions, and bootstrap uncertainty. A related regulatory-enforcement outcome does not reproduce that interaction. The results support neither a general causal claim that institutions amplify leadership nor a general claim that they substitute for it. Their value is to show why a strong association between adjacent governance indicators cannot be treated as sufficient evidence of a broader institutional mechanism. The reproducible model-component ablation and diagnostic analyses provide a basis for refining subsequent tests with aligned reference periods, more distinct measures, and designs capable of identifying implementation processes rather than only aggregate conditional patterns.
Research transparency and data availability
No new individual-level data were collected or used for interviews, surveys, or interventions. Published country-level indicators are used for the analysis. The replication package contains the analytic dataset without the identifiers, the analytic code that was executed, the numerical results, publication figures, where the data came from, and a script to verify the full source. The data provided here is a research extraction from the official published data of BTI, V-Dem, WJP, and BIPA. When being reused, source attribution and source terms are to be kept. The submission of an article is made with the knowledge that no approval or declaration is invented here, but only that of the submitting author, who is responsible for confirming institutional ethics requirements, authorship, funding, competing interests, and disclosure of any AI-assisted work.
References
- [1] Matland RE. Synthesizing the implementation literature: The ambiguity-conflict model of policy implementation. Journal of Public Administration Research and Theory. 1995;5(2):145–174. https://doi.org/10.1093/oxfordjournals.jpart.a037242
- [2] Pressman JL, Wildavsky A. Implementation. 3rd ed. University of California Press; 1984. https://www.ucpress.edu/books/implementation/paper
- [3] Sabatier PA. Top-down and bottom-up approaches to implementation research: A critical analysis and suggested synthesis. Journal of Public Policy. 1986;6(1):21–48. https://doi.org/10.1017/S0143814X00003846
- [4] Andrews M, Pritchett L, Woolcock M. Building state capability: Evidence, analysis, action. Oxford University Press; 2017. https://doi.org/10.1093/acprof:oso/9780198747482.001.0001
- [5] Pritchett L, Woolcock M, Andrews M. Looking like a state: Techniques of persistent failure in state capability for implementation. The Journal of Development Studies. 2013;49(1):1–18. https://doi.org/10.1080/00220388.2012.709614
- [6] Howlett M, Ramesh M. Achilles’ heels of governance: Critical capacity deficits and their role in governance failures. Regulation & Governance. 2016;10(4):301–313. https://doi.org/10.1111/rego.12091
- [7] Wu X, Ramesh M, Howlett M. Policy capacity: A conceptual framework for understanding policy competences and capabilities. Policy and Society. 2015;34(3–4):165–171. https://doi.org/10.1016/j.polsoc.2015.09.001
- [8] Blavatnik School of Government. Blavatnik Index of Public Administration 2024. University of Oxford; 2024. https://doi.org/10.35489/BSG-INDEX_2024/01
- [9] Adcock R, Collier D. Measurement validity: A shared standard for qualitative and quantitative research. American Political Science Review. 2001;95(3):529–546. https://doi.org/10.1017/S0003055401003100
- [10] Hainmueller J, Mummolo J, Xu Y. How much should we trust estimates from multiplicative interaction models? Simple tools to improve empirical practice. Political Analysis. 2019;27(2):163–192. https://doi.org/10.1017/pan.2018.46
- [11] Fukuyama F. What is governance? Governance. 2013;26(3):347–368. https://doi.org/10.1111/gove.12035
- [12] North DC. Institutions, institutional change and economic performance. Cambridge University Press; 1990. https://doi.org/10.1017/CBO9780511808678
- [13] Hanson JK, Sigman R. Leviathan’s latent dimensions: Measuring state capacity for comparative political research. The Journal of Politics. 2021;83(4):1495–1510. https://doi.org/10.1086/715066
- [14] O’Reilly C, Murphy RH. An index measuring state capacity, 1789–2018. Economica. 2022;89(355):713–745. https://doi.org/10.1111/ecca.12411
- [15] Rothstein B, Teorell J. What is quality of government? A theory of impartial government institutions. Governance. 2008;21(2):165–190. https://doi.org/10.1111/j.1468-0491.2008.00391.x
- [16] Evans P, Rauch JE. Bureaucracy and growth: A cross-national analysis of the effects of “Weberian” state structures on economic growth. American Sociological Review. 1999;64(5):748–765. https://doi.org/10.1177/000312249906400508
- [17] Rauch JE, Evans PB. Bureaucratic structure and bureaucratic performance in less developed countries. Journal of Public Economics. 2000;75(1):49–71. https://doi.org/10.1016/S0047-2727(99)00044-4
- [18] Cornell A, Knutsen CH, Teorell J. Bureaucracy and growth. Comparative Political Studies. 2020;53(14):2246–2282. https://doi.org/10.1177/0010414020912262
- [19] Cingolani L, Thomsson K, de Crombrugghe D. Minding Weber more than ever? The impacts of state capacity and bureaucratic autonomy on development goals. World Development. 2015;72:191–207. https://doi.org/10.1016/j.worlddev.2015.02.016
- [20] Lipsky M. Street-level bureaucracy: Dilemmas of the individual in public services. 30th anniversary expanded ed. Russell Sage Foundation; 2010. https://doi.org/10.7758/9781610446631
- [21] Gulzar S, Pasquale BJ. Politicians, bureaucrats, and development: Evidence from India. American Political Science Review. 2017;111(1):162–183. https://doi.org/10.1017/S0003055416000502
- [22] Rasul I, Rogger D. Management of bureaucrats and public service delivery: Evidence from the Nigerian Civil Service. The Economic Journal. 2018;128(608):413–446. https://doi.org/10.1111/ecoj.12418
- [23] Bertelsmann Stiftung. BTI 2024 codebook for country assessments. Bertelsmann Stiftung; 2024. https://bti-project.org/fileadmin/api/content/en/downloads/codebooks/BTI2024_Codebook.pdf
- [24] Besley T, Persson T. The origins of state capacity: Property rights, taxation, and politics. American Economic Review. 2009;99(4):1218–1244. https://doi.org/10.1257/aer.99.4.1218
- [25] Suryanarayan P. Endogenous state capacity. Annual Review of Political Science. 2024;27:223–243. https://doi.org/10.1146/annurev-polisci-061621-084709
- [26] Blavatnik School of Government. Blavatnik Index of Public Administration 2024: Index data and code. GitHub; 2024. https://github.com/blavatnik-index/bipa2024_index
- [27] Blavatnik School of Government. Blavatnik Index of Public Administration 2024: Source data and processing documentation. GitHub; 2024. https://github.com/blavatnik-index/bipa2024_sourcedata
- [28] Hamadeh N, Van Rompaey C, Metreau E. World Bank Group country classifications by income level for FY24 (July 1, 2023–June 30, 2024). 2023. World Bank Blogs. https://blogs.worldbank.org/en/opendata/new-world-bank-group-country-classifications-income-level-fy24
- [29] Coppedge M, Gerring J, Knutsen CH, Lindberg SI, Teorell J, Altman D, et al. V-Dem codebook v14. Varieties of Democracy (V-Dem) Project; 2024. https://doi.org/10.2139/ssrn.4774440
- [30] World Justice Project. WJP rule of law index 2023. World Justice Project; 2023. https://worldjusticeproject.org/rule-of-law-index/downloads/WJPIndex2023.pdf
- [31] Podsakoff PM, MacKenzie SB, Lee J-Y, Podsakoff NP. Common method biases in behavioral research: A critical review of the literature and recommended remedies. Journal of Applied Psychology. 2003;88(5):879–903. https://doi.org/10.1037/0021-9010.88.5.879
- [32] Hayes AF, Cai L. Using heteroskedasticity-consistent standard error estimators in OLS regression: An introduction and software implementation. Behavior Research Methods. 2007;39(4):709–722. https://doi.org/10.3758/BF03192961
- [33] MacKinnon JG, White H. Some heteroskedasticity-consistent covariance matrix estimators with improved finite sample properties. Journal of Econometrics. 1985;29(3):305–325. https://doi.org/10.1016/0304-4076(85)90158-7
- [34] Brambor T, Clark WR, Golder M. Understanding interaction models: Improving empirical analyses. Political Analysis. 2006;14(1):63–82. https://doi.org/10.1093/pan/mpi014
- [35] Wasserstein RL, Lazar NA. The ASA statement on p-values: Context, process, and purpose. The American Statistician. 2016;70(2):129–133. https://doi.org/10.1080/00031305.2016.1154108
- [36] Stone M. Cross-validatory choice and assessment of statistical predictions. Journal of the Royal Statistical Society: Series B (Methodological). 1974;36(2):111–133. https://doi.org/10.1111/j.2517-6161.1974.tb00994.x
- [37] Cook RD. Detection of influential observation in linear regression. Technometrics. 1977;19(1):15–18. https://doi.org/10.1080/00401706.1977.10489493
- [38] Efron B, Tibshirani RJ. An introduction to the bootstrap. Chapman & Hall; 1993. https://doi.org/10.1007/978-1-4899-4541-9
- [39] Rohrer JM. Thinking clearly about correlations and causation: Graphical causal models for observational data. Advances in Methods and Practices in Psychological Science. 2018;1(1):27–42. https://doi.org/10.1177/2515245917745629
- [40] Williams MJ. The political economy of unfinished development projects: Corruption, clientelism, or collective choice? American Political Science Review. 2017;111(4):705–723. https://doi.org/10.1017/S0003055417000351
CITE THIS ARTICLE
Sarker, A. (2024). Leadership, Institutional Capacity, and Policy Implementation: A Study of Governance Challenges in Developing Countries. https://www.researchbyantara.com/article/d583f575-7b33-4871-ba94-21d3276f8999
A. Sarker, “Leadership, Institutional Capacity, and Policy Implementation: A Study of Governance Challenges in Developing Countries,” 2024. [Online]. Available: https://www.researchbyantara.com/article/d583f575-7b33-4871-ba94-21d3276f8999
Sarker, A. (2024) ‘Leadership, Institutional Capacity, and Policy Implementation: A Study of Governance Challenges in Developing Countries’. Available at: https://www.researchbyantara.com/article/d583f575-7b33-4871-ba94-21d3276f8999
Sarker, Antara. “Leadership, Institutional Capacity, and Policy Implementation: A Study of Governance Challenges in Developing Countries.” 2024, https://www.researchbyantara.com/article/d583f575-7b33-4871-ba94-21d3276f8999.
Antara Sarker. “Leadership, Institutional Capacity, and Policy Implementation: A Study of Governance Challenges in Developing Countries.” (2024). https://www.researchbyantara.com/article/d583f575-7b33-4871-ba94-21d3276f8999.
Sarker A. Leadership, Institutional Capacity, and Policy Implementation: A Study of Governance Challenges in Developing Countries. 2024. https://www.researchbyantara.com/article/d583f575-7b33-4871-ba94-21d3276f8999
@misc{article_d583f5757b334871ba9421d3276f8999,
  title = {Leadership, Institutional Capacity, and Policy Implementation: A Study of Governance Challenges in Developing Countries},
  author = {Antara Sarker},
  year = {2024},
  url = {https://www.researchbyantara.com/article/d583f575-7b33-4871-ba94-21d3276f8999},
}
TY - GEN AU - Antara Sarker TI - Leadership, Institutional Capacity, and Policy Implementation: A Study of Governance Challenges in Developing Countries PY - 2024 UR - https://www.researchbyantara.com/article/d583f575-7b33-4871-ba94-21d3276f8999 ER -